
# Getting started
# 1. Zamna Client integration scheme
Airline is required to deploy and configure the Zamna Client stack within its own infrastructure (on-prem or Cloud). Zamna Client then provides APIs, callable from within the Airline existing business processes and touch-points.
Crucially, no personal data is ever stored or exposed from Airline security premises using Zamna. Through the installation process, network and firewall configuration is updated to allow Zamna Client to communicate with the Zamna Cloud and other authenticated Trusted Peer Nodes.
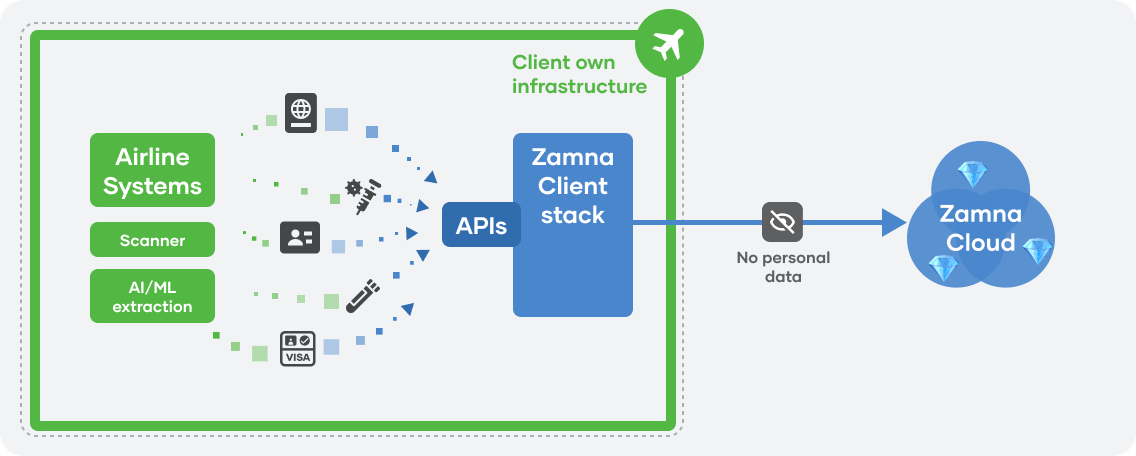
Integration with PSS
Depending on the desired integration flow, Zamna Client can connect to Airline PSS (Altea, Navitaire, Sabre, etc.) via existing APIs/Web-services:
- get booking/PNR and passenger data (including passport, if is in DCS)
- set passport (APIS) data
- add/remove documents
- set/unset documents as verified
- (optional) set and remove SSRs
- (optional) set and remove HPCs
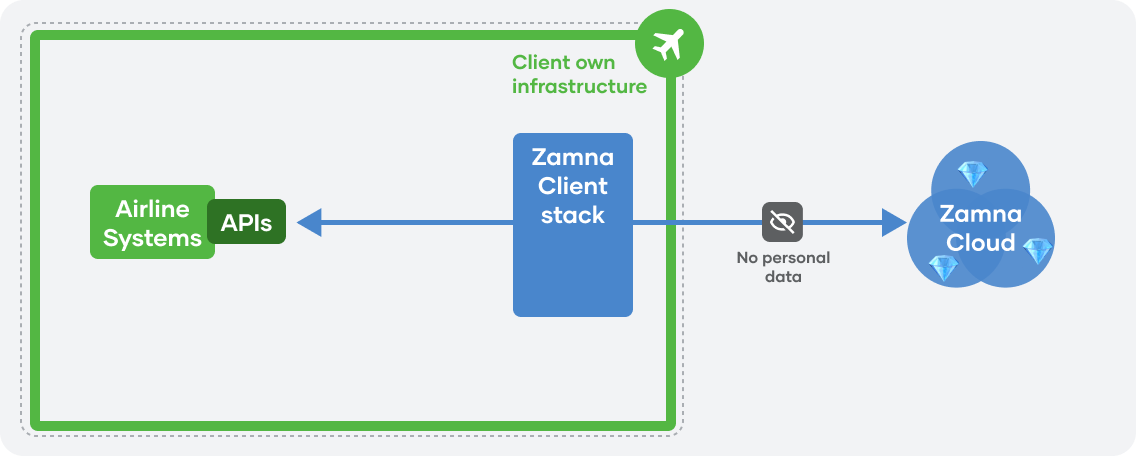
Zamna Client provides APIs for Airline own applications/touch-points to interact with:
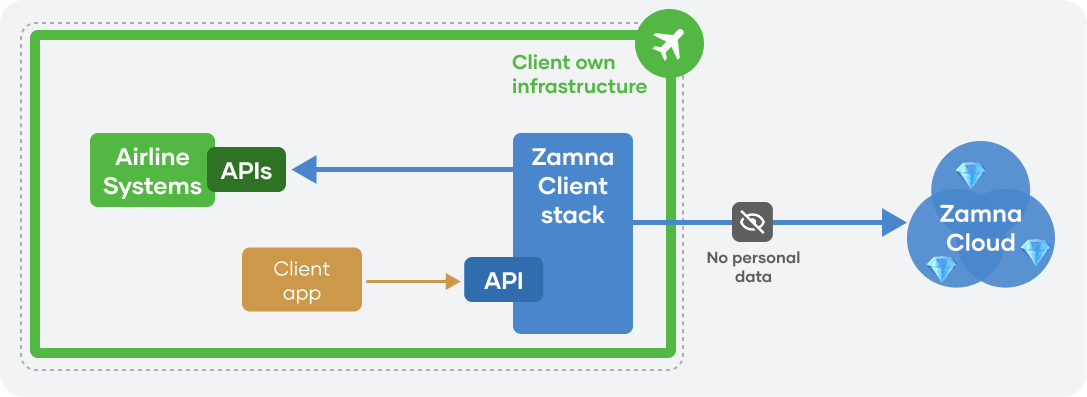
The main API for passenger-facing flows is the Ready To Fly API.
# 2. Zamna Client stack overivew
The Zamna Client stack comprises following components:
ApiServer— Kotlin/Java Server Application running on javalin (opens new window), serving the main functionality and Zamna Client APIs,Database— a PostgreSQL database, where only operational (not personal) data is stored (under Airline full management and control),
Optional components/modules:
WebView— customer (passsenger) facing frontend Single-Page Application,ID documents processing— a module to verify and extract data from ID documents,PDF documents processing— a module to verify and extract data from PDF documents (e-Visas, etc).
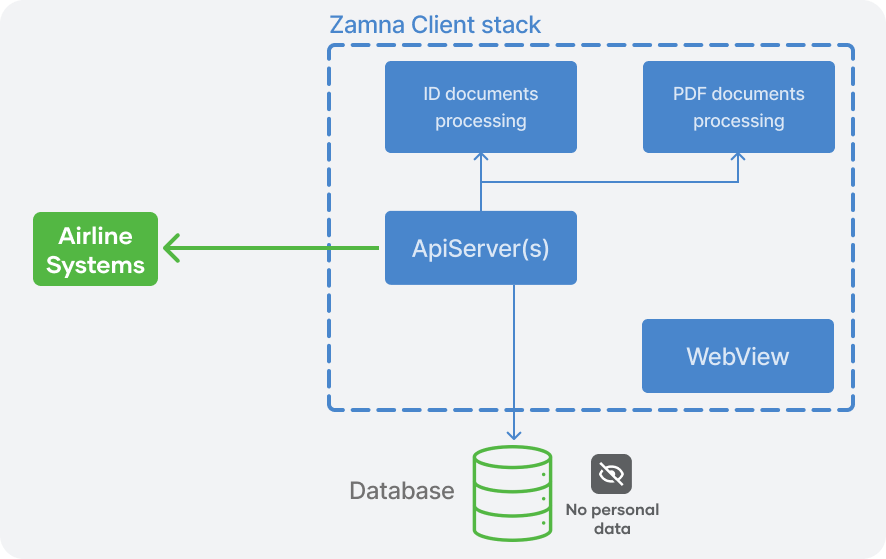
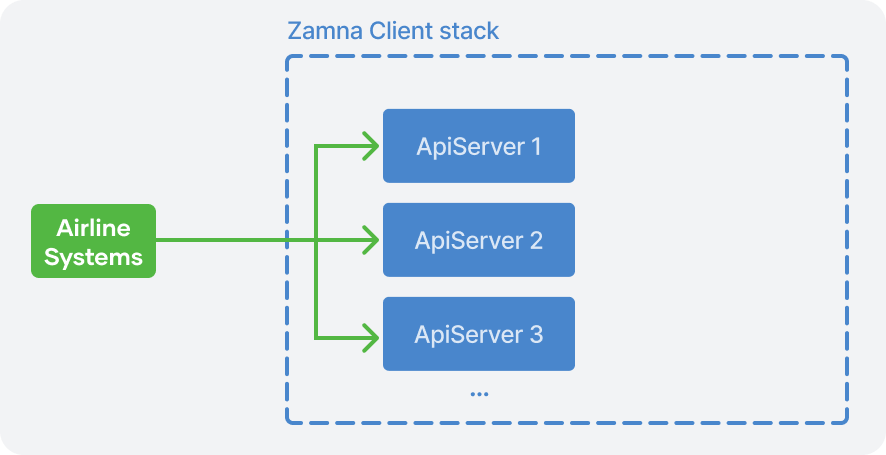
Zamna Client stack supports horisontal scaling — additional ApiServer instances can be added to the cluster when required:
# 3. Technical requirements
We recommend the following specifications for a host machine running ApiServer instance:
- 2x 3.1 GHz CPU
- 4 Gb Mem
For the Database instance we recommend the following minimum requirements:
- DB size: 200Gb
- vCores/CPUs: 2
- IOPS: 1000
We recommend the following specifications for a host machine running PDF documents processing instance:
- 2x 3.1 GHz CPU
- 4 Gb Mem
# 4. Installation
# 4.1. Create credentials
In collaboration with Zamna implementation support engineers, Airline generates (locally, or as part of the pipeline) a set of credentials required to interact securely with the permission-ed network. As part of our procedures, these credentials are regularly renewed.
To generate everything needed to facilitate the connection, replace org_name_here (e.g. "utopiaair") and org_domain_here (e.g. "com.airutopia") with relevant values and run the following command:
Please note
org_name_here should only contain alphanumeric symbols, and org_domain_here should be valid domain name you are in control of
TIP
For Debian, use -d instead of -D for base64
TIP
For Windows, use the B64 tool available on GitHub (opens new window) for base64 encoding
Staging
docker pull zamna/fabricartifacts:staging
docker run -e ORG_NAME=org_name_here -e ORG_DOMAIN=org_domain_here zamna/fabricartifacts:staging | base64 -D > output.tar.gz
Production
docker pull zamna/fabricartifacts:production
docker run -e ORG_NAME=org_name_here -e ORG_DOMAIN=org_domain_here zamna/fabricartifacts:production | base64 -D > output.tar.gz
This will create output.tar.gz file.
To unarchive it, run:
tar -xf output.tar.gz
This will create the output folder consisting of:
crypto-configfolder — contains all cryptographic materials for your organisation. This folder needs to be saved securely — it’s very important not to lose these files.org-config.json— organisation definition of your organisation.connection.yaml— credentials for a connection to decentralised network.
Also, your public keys:
sign_public_key.pemauth_public_key.pemwebserver_auth_public_key.pem
And your private keys:
WARNING
⚠️ Keep private keys secure and never share it with anyone, including Zamna
sign_key.pemauth_key.pemwebserver_auth_key.pem
TIP
Keep secrets in Secret Managers for Cloud deployments (e.g. AWS KMS/Secrets Manager, Azure Key Vault, etc.) and expose them from Secrets Manager to Zamna Client container as environment variables
# 4.2. Network and Firewall configuration
ApiServer requires access to the following URLs:
Staging environment
- apiserver.staging.zamna.com
- checklist-stats.staging.zamna.com
- name-matching-stats.staging.zamna.com
- rules-engine.staging.zamna.com
- confucius.staging.zamna.com
- traduora.production.zamna.com
- growthbook-api.production.zamna.com
- s3.eu-west-1.amazonaws.com
- monitoring.eu-west-1.amazonaws.com
- logs.eu-west-1.amazonaws.com
- doctr-static.mindee.com
- lic.regulaforensics.com
Production environment
- apiserver.production.zamna.com
- checklist-stats.production.zamna.com
- name-matching-stats.production.zamna.com
- rules-engine.production.zamna.com
- confucius.production.zamna.com
- traduora.production.zamna.com
- growthbook-api.production.zamna.com
- s3.eu-west-1.amazonaws.com
- monitoring.eu-west-1.amazonaws.com
- logs.eu-west-1.amazonaws.com
- doctr-static.mindee.com
- lic.regulaforensics.com
Access to Airline services and APIs
If the integration flow requires Zamna Client to connect to Airline own services and APIs (ie DCS), it will also require access
# 4.3. Deploy Zamna Client stack
TIP
Zamna Client stack can be deployed in several ways: ranging from simple Docker images to Terraform/Kubernetes scripts or Ansible playbooks - depending on existing Airline infrastructure, restrictions, and IT strategy/policy.
Zamna's implementation engineers will undertake an initial technical scoping to ensure the fastest and easiest deployment option is selected and will provide all required materials and ongoing live support.
General deployment process
Zamna will provide access to its private Docker images repository (Dockerhub or AWS ECR) — Docker images of all the Zamna Client stack components can be pulled to an Airline own container registry (eg AWS ECR/Azure ACR), from where they can be utilised as part of the CI/DI pipeline.
Additionally, Zamna can configure its own CI/DI pipeline to push new versions of images directly to Airline own image repositories.
# 4.3.1. (optional) Deploy ID documents processing module
Zamna is integrated with a number of ID & online document verification platforms out of the box. Either Airline have pre-existing partnerships, so Zamna Client can utilise it - or Zamna can source required functionality from a rouster of pre-approved and fully integrated solutions.
# 4.3.2. (optional) Deploy PDF documents processing module
The module is distributed as Docker image.
AWS ECR
230436152505.dkr.ecr.eu-west-1.amazonaws.com/data-extractor
Dockerhub
zamna/data-extractor
No additional configuration is required.
# 4.3.3. Deploy ApiServer
Note
ApiServer requires access to:
DatabaseID documents processing(if used, for Ready To Fly)PDF documents processing(if used, for Ready To Fly)DCS(for Ready To Fly)
The module is distributed as Docker image.
Ready To Fly API configuration
AWS ECR
230436152505.dkr.ecr.eu-west-1.amazonaws.com/paxcheck-app
Dockerhub
zamna/paxcheckapp
The following environment variables should be injected into the container from Secrets Manager:
AUTH__PRIVATE_KEY— base64 encoded contents ofauth_key.pemfileSIGNALS__WRITE__SIGNING_PRIVATE_KEY— base64 encoded contents ofsign_key.pemfileSIGNALS__WRITE__DELETION_SECRET— base64 encoded string (min 32 bytes)SERVER__AUTH_SECRET_KEY— base64 encoded contents ofwebserver_auth_key.pemfileAIRLINE_ENCRYPTION_CONFIG__KEY— AES key for booking identifiers encryptionAIRLINE_ENCRYPTION_CONFIG__IV— AES IV for booking identifiers encryptionSERVER__RECAPTCHA_SECRET— optional. Only required when the WebView index login page is enabled (REACT_APP_DISSALOW_INDEX_LOGIN=false). Omit or leave empty for the standard/start2flow (default). When required, Zamna provides a JSON value for reCAPTCHA Enterprise verification onPOST /start-with-booking-id-and-surname:{"apiKey":"...","siteKey":"...","projectId":"..."}The
siteKeymust match the WebViewREACT_APP_RECAPTCHA_SITE_KEY. See WebView — Configuration.
Additionally, driven by an Airline environment and setup, Zamna will provide a personalised configuration.yaml file to be placed inside the container — from which ApiServer reads its configuration.
# 4.3.4. (optional) Deploy WebView
The module is distributed as Docker image — as design/UX is personalised for each Airline, Zamna will provide access to a dedicated WebView Docker image.
WebView environment variables
| Variable | Required | Description |
|---|---|---|
REACT_APP_DISSALOW_INDEX_LOGIN | Yes | "true" (default) hides the index login page — passengers enter via /start2 with an encrypted booking id. "false" shows a booking id + surname login page at /login and requires reCAPTCHA (see below) |
REACT_APP_RECAPTCHA_SITE_KEY | Conditional | reCAPTCHA Enterprise site key. Required only when REACT_APP_DISSALOW_INDEX_LOGIN=false. Must match the siteKey in ApiServer SERVER__RECAPTCHA_SECRET |
When deploying via the Ready To Fly Helm chart, set webview.disallowIndexLogin instead — the chart maps it to REACT_APP_DISSALOW_INDEX_LOGIN and skips SERVER__RECAPTCHA_SECRET on ApiServer when index login is disabled (the default).
No other WebView configuration is required for the standard hosted deployment.
# 5. Monitoring
The deployed Zamna Client stack exposes Prometheus metrics for operational monitoring. Metric names below are exactly as they appear in the /metrics scrape output, ready for use in Grafana or other Prometheus-compatible tooling.
Most metrics are scraped from the ApiServer dedicated metrics port. The QQ task queue and PDF documents processing module (data-extractor) each expose a separate /metrics endpoint on their own port (default 9090).
ApiServer metrics are tagged with clientId, identifying the airline deployment. QQ and data-extractor metrics use the client_id label.
# Metric types
Latency metrics (request duration) publish three series per name:
| Series | Use for |
|---|---|
{name}_seconds_count | Request count |
{name}_seconds_sum | Total duration (divide by count for average) |
{name}_seconds_max | Peak duration in the scrape interval |
Counter metrics publish as {name}_total. Gauge metrics publish as {name}.
Histogram metrics (QQ task durations, data-extractor processing stages) publish as {name}_bucket, {name}_sum, and {name}_count.
For latency metrics, separate series are published for successful and failed calls — suffix _success or _error before _seconds. Failed calls that return an HTTP status also publish a series with the status code in the name (e.g. _error_500_seconds_count).
# 5.1. Zamna Client: Ready To Fly API endpoints
Per-endpoint latency metrics for the Ready To Fly API. Each row lists the API route and the corresponding Prometheus metric base name.
| API endpoint | Method | Prometheus metric base |
|---|---|---|
/start | GET | server_handlers_mm_start1_seconds |
/start2 | GET | server_handlers_mm_start2_seconds |
/start-with-booking-id-and-surname | POST | server_handlers_mm_start_with_booking_id_and_surname_seconds |
/session/{sessionId} | GET | server_handlers_mm_get_session_seconds |
/session/{sessionId}/set-consent | POST | server_handlers_mm_set_consent_seconds |
/session/{sessionId}/pax-session/{paxSessionId} | GET | server_handlers_mm_get_pax_session_seconds |
/session/{sessionId}/pax-session/{paxSessionId}/answers | POST | server_handlers_mm_answers_seconds |
/session/{sessionId}/pax-session/{paxSessionId}/apply-document/travel-document | POST | server_handlers_mm_apply_travel_document_seconds |
/session/{sessionId}/pax-session/{paxSessionId}/apply-document/manual | POST | server_handlers_mm_apply_manual_document_seconds |
/session/{sessionId}/pax-session/{paxSessionId}/recognise-document | POST | server_handlers_mm_recognise_document_seconds |
/session/{sessionId}/pax-session/{paxSessionId}/apply-document/recognised | POST | server_handlers_mm_apply_document_seconds |
/session/{sessionId}/pax-session/{paxSessionId}/address | POST | server_handlers_mm_post_address_seconds |
For any endpoint above, append _success or _error before _seconds for outcome-specific series. Example: server_handlers_mm_start2_success_seconds_count, server_handlers_mm_start2_error_seconds_count, server_handlers_mm_start2_error_500_seconds_count.
Other Ready To Fly API metrics:
| Prometheus metric | Type | Description |
|---|---|---|
server_handlers_mm_parallel_requests | Gauge | In-flight multipax session requests |
paxcheck_checklist_total | Counter | Checklists created |
# 5.2. Zamna Client → DCS
DCS metrics are recorded per DCS operation (e.g. load booking, set document). A single operation may involve multiple underlying API or SOAP calls. Only the DCS integration configured for a given deployment will publish metrics.
Append _success or _error before _seconds for outcome-specific latency series.
# Sabre
| Prometheus metric base | DCS operation s |
|---|---|
com_zamna_paxcheck_dcs_sabre_soap_getBooking_seconds | Load booking / passenger data |
com_zamna_paxcheck_dcs_sabre_soap_setDocument_seconds | Write travel document |
com_zamna_paxcheck_dcs_sabre_soap_resetAllDocumentsExceptOfType_seconds | Reset documents |
com_zamna_paxcheck_dcs_sabre_soap_setNextFlight_seconds | Set onward flight |
com_zamna_paxcheck_dcs_sabre_soap_setDocvFlag_seconds | Set DOCV flag |
Background task metrics (deferred DOCV / security-info updates):
| Prometheus metric | Type | Description |
|---|---|---|
com_zamna_paxcheck_dcs_sabre_soap_securityInfo_executed_count_total | Counter | Tasks attempted |
com_zamna_paxcheck_dcs_sabre_soap_securityInfo_success_count_total | Counter | Tasks succeeded |
com_zamna_paxcheck_dcs_sabre_soap_securityInfo_error_count_total | Counter | Tasks failed |
com_zamna_paxcheck_dcs_sabre_soap_securityInfo_maxAttemptsReached_count_total | Counter | Tasks abandoned after max retries |
com_zamna_paxcheck_dcs_sabre_soap_securityInfo_successAttempt | Gauge | Attempt number on last successful execution |
com_zamna_paxcheck_dcs_sabre_soap_docvTask_docv_scheduled_count_total | Counter | DOCV tasks scheduled |
com_zamna_paxcheck_dcs_sabre_soap_docvTask_docv_canceled_count_total | Counter | DOCV tasks canceled |
com_zamna_paxcheck_dcs_sabre_soap_docvTask_return_date_scheduled_count_total | Counter | Return-date tasks scheduled |
# Radixx
| Prometheus metric base | DCS operation |
|---|---|
com_zamna_paxcheck_dcs_radixconnectpoint_getToken_seconds | Authentication |
com_zamna_paxcheck_dcs_radixconnectpoint_retrievePNR_seconds | Load booking |
com_zamna_paxcheck_dcs_radixconnectpoint_retrieveApisInfo_seconds | Retrieve APIS data |
com_zamna_paxcheck_dcs_radixconnectpoint_addUpdateApisInfo_seconds | Add or update APIS data |
com_zamna_paxcheck_dcs_radixconnectpoint_createPNR_seconds | Create PNR |
com_zamna_paxcheck_dcs_radixconnectpoint_modifyPNR_seconds | Modify PNR |
com_zamna_paxcheck_dcs_radixconnectpoint_retrieveAARQuote_seconds | Retrieve AAR quote |
# Navitaire
Navitaire metrics are available at two levels: DCS operations and individual Navitaire API calls.
DCS operations:
| Prometheus metric base | DCS operation |
|---|---|
com_zamna_paxcheck_dcs_navitaire_rest_setDocument_seconds | Write travel document |
com_zamna_paxcheck_dcs_navitaire_rest_setDocumentAsVerified_seconds | Mark document as verified |
com_zamna_paxcheck_dcs_navitaire_rest_removeDocumentVerifications_seconds | Remove document verifications |
com_zamna_paxcheck_dcs_navitaire_rest_addVerifiedDocument_seconds | Add verified document |
com_zamna_paxcheck_dcs_navitaire_rest_setVerifiedDocuments_seconds | Set verified documents |
com_zamna_paxcheck_dcs_navitaire_rest_deleteDocuments_seconds | Delete documents |
Navitaire API calls:
| Prometheus metric base | API call |
|---|---|
com_zamna_paxcheck_dcs_navitaire_rest_client_booking_get_stateless_seconds | Get booking (stateless) |
com_zamna_paxcheck_dcs_navitaire_rest_client_booking_get_stateful_seconds | Get booking (stateful) |
com_zamna_paxcheck_dcs_navitaire_rest_client_booking_get_from_state_seconds | Get booking from session state |
com_zamna_paxcheck_dcs_navitaire_rest_client_commit_seconds | Commit booking changes |
com_zamna_paxcheck_dcs_navitaire_rest_client_addDocument_seconds | Add travel document |
com_zamna_paxcheck_dcs_navitaire_rest_client_addDocumentInfant_seconds | Add infant travel document |
com_zamna_paxcheck_dcs_navitaire_rest_client_updateDocument_seconds | Update travel document |
com_zamna_paxcheck_dcs_navitaire_rest_client_updateDocumentInfant_seconds | Update infant travel document |
com_zamna_paxcheck_dcs_navitaire_rest_client_deleteDocument_seconds | Delete travel document |
com_zamna_paxcheck_dcs_navitaire_rest_client_deleteDocumentInfant_seconds | Delete infant travel document |
com_zamna_paxcheck_dcs_navitaire_rest_client_updatePassengerName_seconds | Update passenger name |
com_zamna_paxcheck_dcs_navitaire_rest_client_updatePassengerInfantName_seconds | Update infant passenger name |
com_zamna_paxcheck_dcs_navitaire_rest_client_addAddress_seconds | Add passenger address |
com_zamna_paxcheck_dcs_navitaire_rest_client_ssr_set_seconds | Set SSR |
com_zamna_paxcheck_dcs_navitaire_rest_client_ssr_delete_seconds | Delete SSR |
com_zamna_paxcheck_dcs_navitaire_rest_client_verified_docs_put_seconds | Set verified documents |
com_zamna_paxcheck_dcs_navitaire_rest_client_verified_docs_delete_seconds | Delete verified documents |
com_zamna_paxcheck_dcs_navitaire_rest_client_token_upgrade_seconds | Upgrade API token |
Background task metrics (deferred document verification):
| Prometheus metric | Type | Description |
|---|---|---|
navitaire_verify_doc_task_executed_tasks_count | Gauge | Tasks executed in the current background run |
# 5.3. Zamna Client → document processing
Document processing metrics are recorded on the ApiServer scrape endpoint when the corresponding backend is configured for the deployment. They cover outbound calls to document recognition providers triggered by /recognise-document and /apply-document flows.
Append _success or _error before _seconds for outcome-specific latency series on backend processing metrics.
# Processing backends
Only backends enabled in the airline configuration publish metrics.
| Prometheus metric base | Backend / provider |
|---|---|
com_zamna_docprocessing_backends_data_extractor_process_seconds | PDF documents (data-extractor) |
com_zamna_docprocessing_backends_microblink_process_seconds | Microblink |
com_zamna_docprocessing_backends_regula_process_seconds | Regula |
# 5.4. Zamna Client → system metrics
System metrics are published on the ApiServer scrape endpoint alongside application metrics. They cover JVM health, database connection pool usage, and HTTP server thread utilisation.
# JVM and process
| Prometheus metric | Type | Description |
|---|---|---|
jvm_memory_used_bytes | Gauge | JVM memory in use |
jvm_memory_max_bytes | Gauge | JVM memory limit |
jvm_memory_committed_bytes | Gauge | JVM committed memory |
jvm_threads_live_threads | Gauge | Live JVM threads |
jvm_threads_daemon_threads | Gauge | Daemon JVM threads |
jvm_threads_peak_threads | Gauge | Peak JVM thread count |
process_cpu_usage | Gauge | Process CPU utilisation (0-1) |
system_cpu_usage | Gauge | System CPU utilisation (0-1) |
system_cpu_count | Gauge | Available CPU cores |
# Database connection pool (HikariCP)
| Prometheus metric | Type | Description |
|---|---|---|
hikaricp_connections_usage | Gauge | Active connections per pool (pool label) |
# HTTP server (Jetty)
| Prometheus metric | Type | Description |
|---|---|---|
jetty_server_dispatches_total | Counter | Requests dispatched |
jetty_threads_current | Gauge | Jetty worker threads |
jetty_threads_busy | Gauge | Busy Jetty worker threads |
jetty_threads_idle | Gauge | Idle Jetty worker threads |
jetty_server_requests_total | Counter | Requests by method and path |
jetty_server_request_duration_seconds | Histogram | Request duration (_count, _sum, _max) |
# 5.5. QQ task queue
The QQ service manages asynchronous PDF processing tasks between ApiServer and the PDF documents processing module. It exposes Prometheus metrics on a separate /metrics endpoint (default port 9090). Metrics use the client_id label.
| Prometheus metric | Type | Description |
|---|---|---|
qq_tasks_queued_count | Counter | Tasks enqueued |
qq_tasks_pulled_count | Counter | Tasks pulled by workers |
qq_tasks_completed_count | Counter | Tasks completed successfully |
qq_tasks_failed_count | Counter | Tasks that failed |
qq_tasks_requeued_count | Counter | Tasks requeued after lease expiration |
qq_queue_depth | Gauge | Tasks waiting in the queue |
qq_task_duration_queued_ms | Histogram | Time in queue before pull (ms) |
qq_task_duration_completed_ms | Histogram | End-to-end duration for completed tasks (ms) |
qq_task_duration_failed_ms | Histogram | End-to-end duration for failed tasks (ms) |
# 5.6. PDF documents processing module (data-extractor)
The zamna/data-extractor service exposes Prometheus metrics on a separate /metrics endpoint (default port 9090). Metrics use the client_id label; timing histograms also carry a doc_type label.
ApiServer-side metrics in §5.3 record outbound calls from ApiServer to data-extractor. The metrics below record processing inside the data-extractor service itself.
# Resource and queue gauges
| Prometheus metric | Type | Description |
|---|---|---|
data_extractor_container_memory_usage_bytes | Gauge | Container memory usage |
data_extractor_workers_memory_rss_bytes | Gauge | Sum of worker process RSS memory |
data_extractor_memory_rss_bytes | Gauge | Main process RSS memory |
data_extractor_memory_vms_bytes | Gauge | Main process VMS memory |
data_extractor_memory_shared_bytes | Gauge | Main process shared memory |
data_extractor_cpu_percent | Gauge | Process CPU usage (percent) |
data_extractor_cpu_limit | Gauge | Configured CPU limit |
data_extractor_memory_limit_bytes | Gauge | Configured memory limit |
data_extractor_parallel_requests_count | Gauge | In-flight requests |
data_extractor_processing_tasks_queue_size | Gauge | Tasks waiting in the processing queue |
data_extractor_parallel_processing_count | Gauge | Tasks currently being processed |
# Counters
| Prometheus metric | Type | Labels | Description |
|---|---|---|---|
data_extractor_processing_batch_pages_total | Counter | doc_type | Pages processed in batches |
# Processing duration histograms
Each histogram is labelled with doc_type. Series publish as {name}_bucket, {name}_sum, and {name}_count.
| Prometheus metric | Description |
|---|---|
data_extractor_request_seconds | End-to-end request duration |
data_extractor_processing_seconds | Total processing duration |
data_extractor_queueing_seconds | Time spent waiting in queue |
data_extractor_ocr_seconds | OCR stage duration |
data_extractor_labeling_seconds | Labeling stage duration |
data_extractor_prep_seconds | Preparation stage duration |
data_extractor_overhead_seconds | Processing overhead duration |
# Example queries
Filter by airline deployment using the clientId label:
# Scoped to a single deployment
rate(server_handlers_mm_start2_seconds_count{clientId="your-client-id"}[5m])
# Ready To Fly: session start request rate
rate(server_handlers_mm_start2_seconds_count[5m])

# Ready To Fly: session start error rate
rate(server_handlers_mm_start2_error_seconds_count[5m])

# Ready To Fly: session start success rate (%)
100 * rate(server_handlers_mm_start2_success_seconds_count[5m])
    / rate(server_handlers_mm_start2_seconds_count[5m])

# Ready To Fly: session start average latency (ms)
1000 * rate(server_handlers_mm_start2_seconds_sum[5m])
     / rate(server_handlers_mm_start2_seconds_count[5m])

# Sabre: getBooking request rate
rate(com_zamna_paxcheck_dcs_sabre_soap_getBooking_seconds_count[5m])

# Sabre: getBooking error rate
rate(com_zamna_paxcheck_dcs_sabre_soap_getBooking_error_seconds_count[5m])

# Sabre: getBooking success rate (%)
100 * rate(com_zamna_paxcheck_dcs_sabre_soap_getBooking_success_seconds_count[5m])
    / rate(com_zamna_paxcheck_dcs_sabre_soap_getBooking_seconds_count[5m])

# Navitaire: booking load request rate
rate(com_zamna_paxcheck_dcs_navitaire_rest_client_booking_get_stateless_seconds_count[5m])

# Document processing: Regula request rate (when Regula backend is enabled)
rate(com_zamna_docprocessing_backends_regula_process_seconds_count[5m])

# Document processing: Regula error rate
rate(com_zamna_docprocessing_backends_regula_process_error_seconds_count[5m])

# Document processing: data-extractor cache hit rate
rate(com_zamna_docprocessing_data_extractor_cache_cache_hits_total[5m])
    / rate(com_zamna_docprocessing_data_extractor_cache_requests_total[5m])

# QQ: task completion rate
rate(qq_tasks_completed_count{client_id="your-client-id"}[5m])

# QQ: current queue depth
qq_queue_depth{client_id="your-client-id"}

# QQ: average time tasks spend queued (ms)
rate(qq_task_duration_queued_ms_sum{client_id="your-client-id"}[5m])
    / rate(qq_task_duration_queued_ms_count{client_id="your-client-id"}[5m])

# data-extractor: request rate
rate(data_extractor_request_seconds_count{client_id="your-client-id"}[5m])

# data-extractor: average processing time (ms)
1000 * rate(data_extractor_processing_seconds_sum{client_id="your-client-id"}[5m])
     / rate(data_extractor_processing_seconds_count{client_id="your-client-id"}[5m])

# data-extractor: in-flight requests
data_extractor_parallel_requests_count{client_id="your-client-id"}